

The following is a transcription from Shailesh’s TestFlix talk on “Common Mistakes in Performance Testing”.
Are you currently working on performance testing or planning to dive into it? Maybe you’ve already taken the first steps on your learning journey. Well, here’s the deal: When it comes to any task, mistakes happen. They’re unavoidable, no matter your field or the kind of task you’re tackling. Believe it or not, even seasoned experts can slip up and make mistakes. And guess what? Performance testing is no exception!
In this post, we’re going to highlight some of the most common performance testing mistakes, that we tend to make during load testing or performance testing cycle. But fear not! We won’t leave you hanging. We’ll also share the absolute best practices for this type of testing. One critical mistake is neglecting to define clear test exit criteria, which can lead to ambiguous testing outcomes. So, let’s begin.
1. Inadequate User Think Time
The very first performance testing mistake that we all make is inadequate user thinking time. This affects how we design our scripts.
For example –
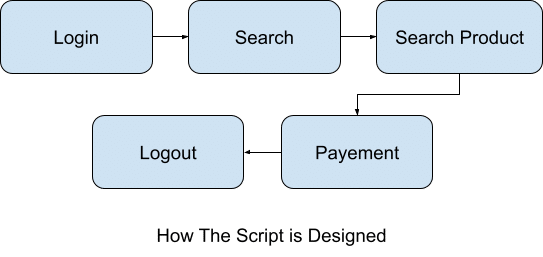
The above script outlines the typical flow of an online shopping website. It suggests a straightforward process: first login, then search for a product, go on to select it, proceed to make the payment, and finally log out.
However, when you run the script and observe the response time, you might notice that it is unexpectedly low. But in reality, things work differently. Because in the script, all your steps are getting executed one by one sequentially.
Actual user behavior and interactions deviate from the scripted process. A user visiting the website would log in first. Once logged in, they would take some time to explore the page, check for offers, read through the content, and get familiar with the layout. Later they would proceed to the search function and enter their query. Once the search results appear, the user would spend some time browsing through them, scrolling, and perhaps navigating through pagination. When they find products of interest, they would select them. After selecting the desired items, the user would then proceed to enter additional details such as their bank information, shipping addresses, and so on. Finally, they would make the payment.
Want to Learn Apache JMeter and Kickstart your Career in Performance Testing? Join the Hands-on Live Workshop on Performance Testing with JMeter and add another high-paying testing skill to your skill set.
Throughout these interactions, there are natural delays that occur, which we refer to as “Think Time.” Even during these moments of contemplation, some users may decide to abandon their journey and leave the website. It’s important to account for these realistic user behaviors and incorporate appropriate “Think Time” into performance testing scenarios.

That’s why, when conducting load testing, it’s crucial to replicate the same user behavior. But how can we achieve that? By incorporating “Think Time” between different stages. This is the key to creating an effective script for our load testing.

To ensure accurate performance testing, it is crucial to follow a specific sequence. Begin by capturing the login scenario, and then incorporate some “Think Time” or “Delay” to replicate realistic user behavior. Next, proceed to the search function, once again incorporating appropriate “Think Time”. After selecting a product, include additional “Think Time” before concluding with the logout step. By adhering to this best practice, you can enhance the accuracy of your performance testing.
Adding “Think Time” in JMeter
If you’re thinking, about how you can add the “Think Time”, then follow these steps:

When using JMeter as a load-testing tool, you have access to various timers. JMeter offers options like Random Timers, Constant Timers, Gaussian Timers, and more. You can choose any of these timers and incorporate the concept of “Think Time.” Adding think time is considered one of the best practices in load testing.
[optin-monster-inline slug=”hvpfp6fjlcity3viwa6t”]
2. Inaccurate Workload Model
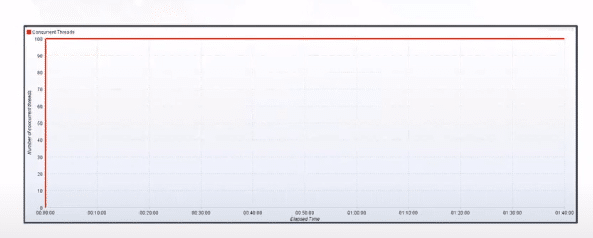
Another common performance testing mistake we make is having an inaccurate workload model. Let’s consider a scenario where we want to test with 100 users. The question is, how should we structure our performance testing workload model? Should we load all 100 users simultaneously right from the start and then maintain that load? Or should we gradually add users, such as introducing 5 users every second or 1 user every second? Determining the ideal workload model is a crucial consideration, and it varies based on the specific context and requirements.
To illustrate, imagine that Flipkart is hosting a major event called “Big Billion Days.” It is scheduled to begin at 12 o’clock and will run for a duration of 2 days. During this time, numerous users will be actively engaged on the platform. In such a scenario, it becomes crucial to establish a particular workload model. Like the one below.
In another scenario, things will be different. Like in the case below –

How to decide on a workload model?
Identifying the workload model is one of the major roles/responsibilities of a performance tester. To achieve this, our first step is to gather information by asking questions. We should inquire with stakeholders, users, and all individuals involved in the project. Here are some examples of the questions we should ask:
- What are the most common or popular transactions?
- How many instances of each transaction occur on an average business day?
- How many instances of each transaction occur on a peak day?
- Which transactions have a high business cost or impact?
By obtaining answers to these questions, we can gather all the necessary pieces of information required to construct our workload model.
Identify The Type of Load Test

Imagine you’re planning to conduct a workload test. Here’s how it works:
- We gradually increase the number of users, let’s say at a rate of 5 users per second.
- Once we reach a certain point, let’s say 100 users, we maintain that load for a specific duration, such as 10, 30, or even 60 minutes. This period of maintaining a constant load is referred to as the “Steady Time.”
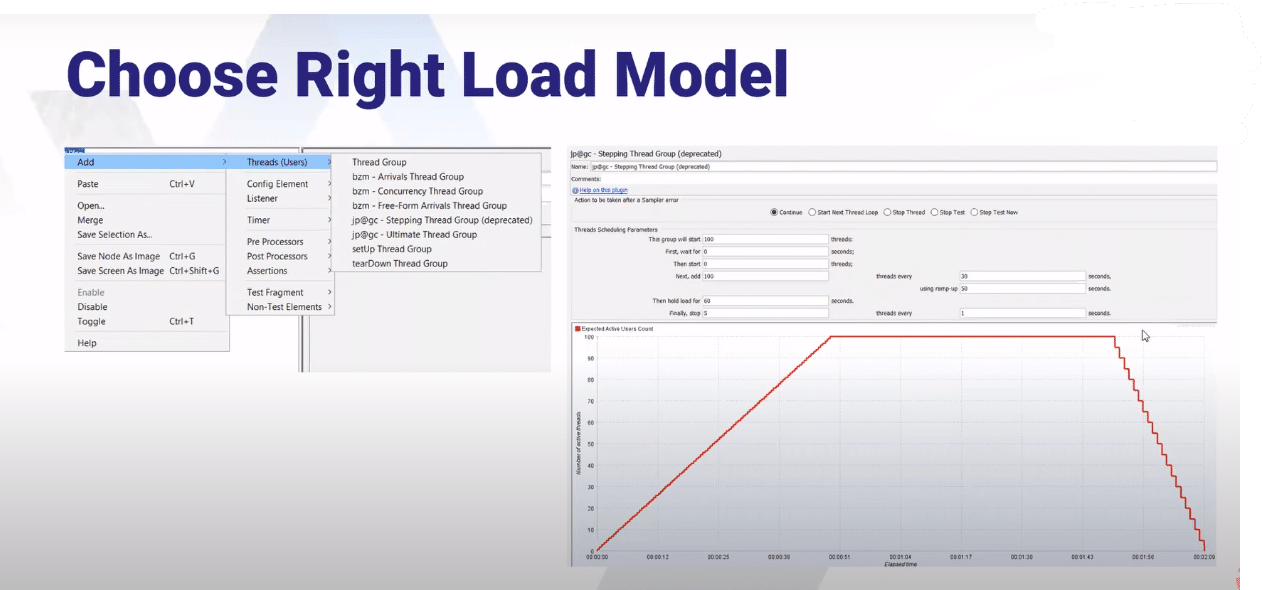
Now, let’s shift our focus to the Peak Test. In this scenario, we follow a different approach.
- We start by ramping up the number of users at a rate of 5 users per second for a duration of 20 seconds. After that, we create a spike in the user load.
- Within a second, we add another 100 users and then continue adding 5 users every second. This way, we can simulate peak traffic conditions. It’s crucial to adjust our load model accordingly to execute this type of test effectively. Developing a comprehensive automated testing strategy helps in avoiding common pitfalls.
If you’re using JMeter for your performance testing, there are specialized plugins available that can assist you in achieving these load patterns. Instead of using the regular thread group, you can utilize plugins like concurrency thread group, ultimate thread groups, and others to configure your desired workload model. You can also opt for other open-source performance testing tools to configure the load pattern.
3. Improper or No Infrastructure Monitoring
Another mistake that we make is improper or no infrastructure monitoring. Let’s assume, we run a test, and below are the results of our tests with 100 users, 500 users & 1000 users.
| No. of Threads | Avg. Response Time (Sec) | Error % | Throughput |
| 100 | 2.2 | 0.00% | 4.5/Sec |
| 500 | 3.1 | 5.00% | 34/Sec |
| 1000 | 3 | 30.00% | 6.7/Sec |
Results of Last 3 Run
Currently, when we have 100 users, our average response time stands at 2.2. As we increase the user count to 500, the average response time rises to 3.1. Surprisingly, with 1000 users, the average response time drops to 3. So, between 500 and 1000 users, we observe a decrease in response time. However, it’s important to note that the error rate also fluctuates. At 500 users, the error rate is 5%, but with 1000 users, it jumps up significantly to 30%.
To gain a better understanding, let’s turn our attention to another table. This table includes an additional column indicating CPU utilization.
| No. of Threads | Avg. Response Time (Sec) | Error % | Throughput | CPU Utilization |
| 100 | 2.2 | 0.00% | 4.5/Sec | 90.00% |
| 500 | 3.1 | 5.00% | 34/Sec | 100.00% |
| 1000 | 3 | 30.00% | 6.7/Sec | 100.00% |
In the given scenario, we observed that the CPU utilization reached 90% with 100 users, but it hit 100% when we scaled up to 500 users. When we encounter a CPU usage of 100%, it is essential to halt our performance testing and prioritize infrastructure evaluation. Increasing our infrastructure becomes necessary, highlighting the critical importance of proper infrastructure monitoring.
Thus, effective monitoring is a very essential skill for performance testers & to facilitate it, there are various tools available such as AppDynamics, PerfMon, DynaTrace, New Relic, and more. These tools offer valuable features, including comprehensive error logging, which can greatly assist in identifying and resolving issues.

4. Inappropriate Data
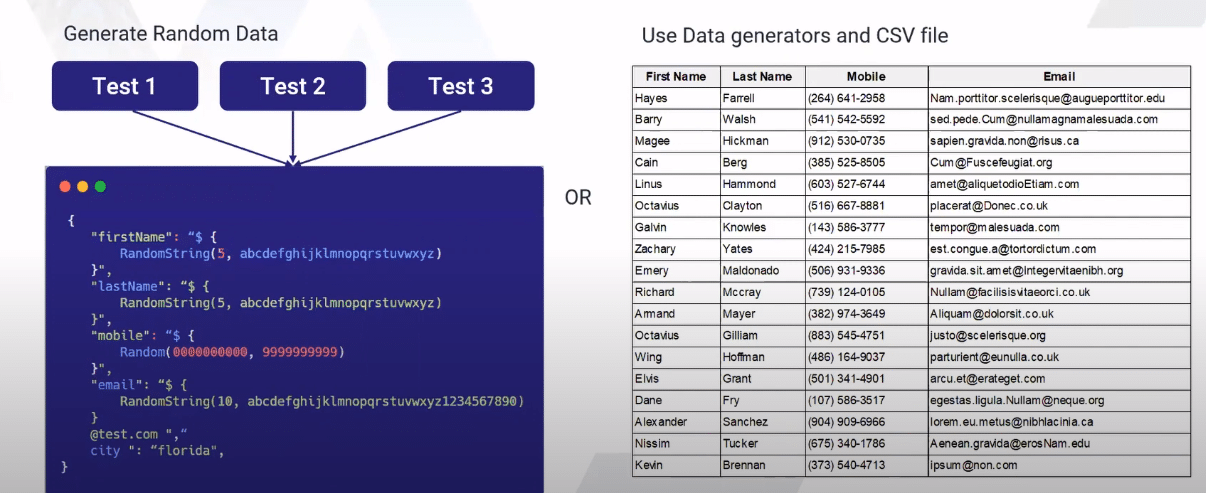
Moving on, another factor to consider is the presence of inappropriate data. To illustrate this, let’s consider a scenario where we have three tests, and each test utilizes a similar dataset. The details of this dataset are outlined in the chart below:

In the current era, caching has become a prevalent feature in modern technologies and intelligent databases. Consequently, when we have multiple tests, whether it be three or three hundred, with identical data, a peculiar outcome arises. This is because the data is retrieved from the cache, which results in a deviation from the expected results.
To tackle this issue, there is a solution if you happen to be using JMeter. Within JMeter, there are several available functions such as random string generation, random number generation, and more. Instead of using actual mobile numbers, you can employ these functions to generate random numbers or utilize a data generator. Additionally, JMeter offers the capability to read data from CSV files. By employing these techniques, you can accomplish your desired outcome while utilizing a distinct dataset.
5. Blank Data Set
Another mistake we often make is working with a blank database. Imagine this: in our production environment, we have a whopping 1 TB of data. However, during the staging phase of performance testing, what do we do? We end up using only a mere 100 or 1000 records. Now, let’s consider a scenario where we have a query –
“Query: Select * from mytable where name=’testFlix’;”
Currently, when there are 100 rows, the results are generated in just 0.5 seconds. However, if the dataset expands to 1 million rows, the processing time increases to 5 seconds. As you can see in the below table, this disparity creates a significant impact.
| No of Rows | Execution Time |
| 100 Rows | 0.5 Sec |
| 10000 Rows | 0.8 Sec |
| 1,00,00,0000 Rows | 5 Sec |
Now, our focus should shift to utilizing large data sets.
Additional Common Mistakes in Performance Testing
Apart from the mistakes already mentioned, there are several other common errors that frequently occur during performance testing. For example:
- Choosing a load engine located in a different geography from where the actual end users are based.
- Overloading load injectors – Instead, utilize multiple load generators for distributed testing.
- Testing only over a LAN (Local Area Network) and neglecting wider network conditions.
- Ignoring script errors that may impact the performance testing results.
- …and many others.
It’s crucial to be aware of these additional pitfalls to ensure comprehensive and accurate performance testing.
Final Words
Alright, folks, listen up! We’ve just laid out some of the most common performance testing mistakes that we absolutely want to bring to your attention. Now, here’s the deal: we’re counting on you all to steer clear of these blunders and instead embrace the best practices we’ve shared. We have complete faith in your abilities!
But hey, we want to take your performance testing skills to the next level. If you’re hungry for more knowledge and want to become an expert in using JMeter, we’ve got just the thing for you. Check out our incredible Performance testing course. It’s a game-changer!


2 thoughts on “5 Common Mistakes in Performance Testing”
[[..Pingback..]] This article was curated as a part of #90th Issue of Software Testing Notes Newsletter. https://softwaretestingnotes.substack.com/p/issue-90-software-testing-notes Web: https://softwaretestingnotes.com